Serial Data Logger and Charts
Use the whole kit as a data logger: one CSV row of soil, water, temperature, humidity and pressure every few seconds. Paste it into a spreadsheet and chart what happens to a plant pot over an afternoon of watering and drying.
What you build and learn
- Logging sensor data as CSV
- Importing Serial Monitor output into a spreadsheet
- Making line charts from time-series data
- Calibrating after the fact, in the spreadsheet
Every LOG_EVERY_S seconds the sketch prints one comma-separated row: row number, seconds since start, soil raw, water raw, temperature, humidity and pressure. If the BME280 is missing it prints NA in those columns instead of stopping.
Raw soil and water values are logged on purpose. You can convert them to percentages later in the spreadsheet using your dry/wet endpoints, without running the experiment again.
The kit has no clock chip, so time is 'seconds since start'. Note the real start time and add it in the spreadsheet.
What this project uses
Every item is in the kit — nothing extra to buy.
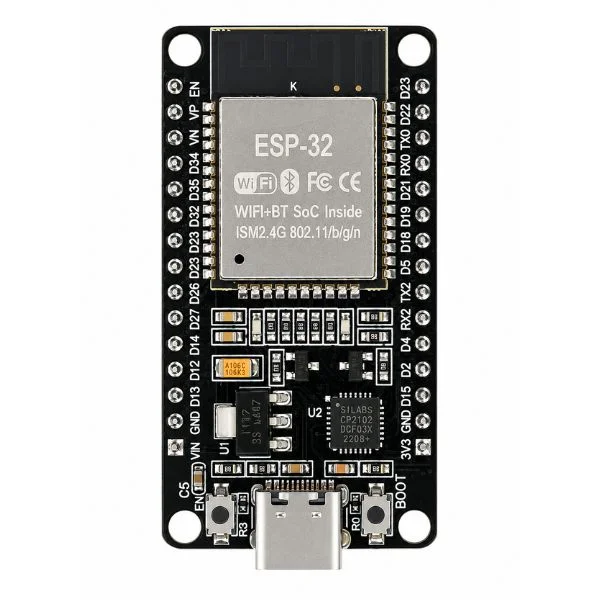
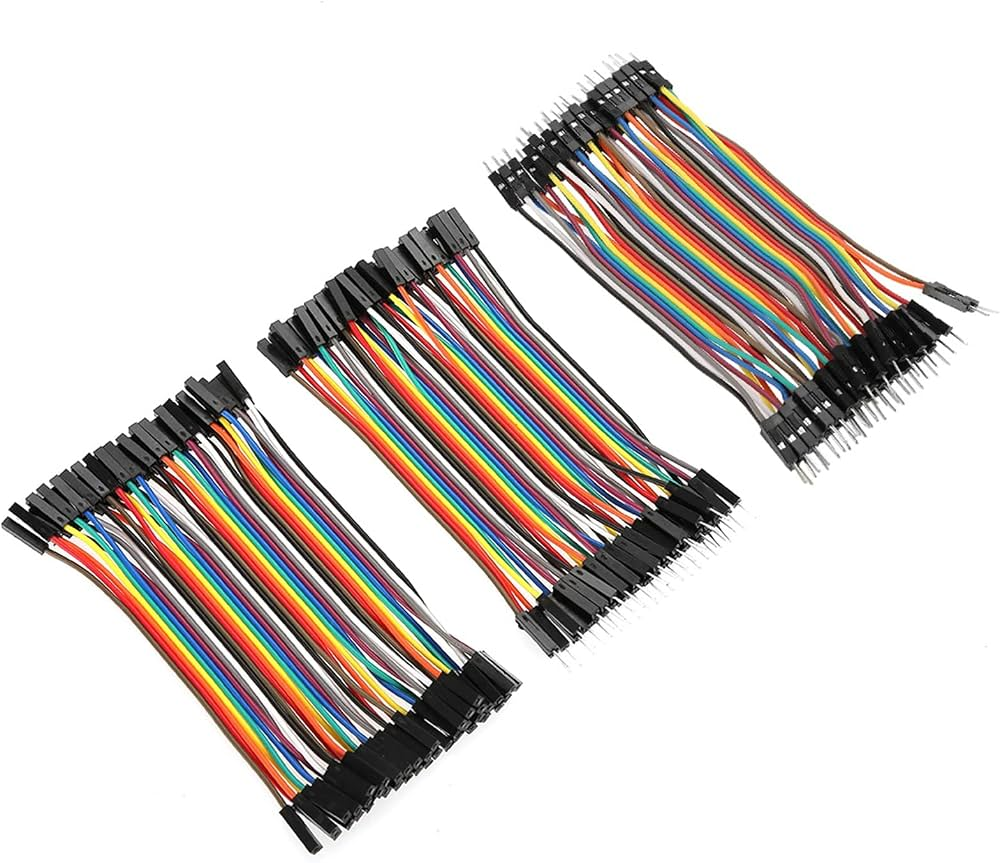
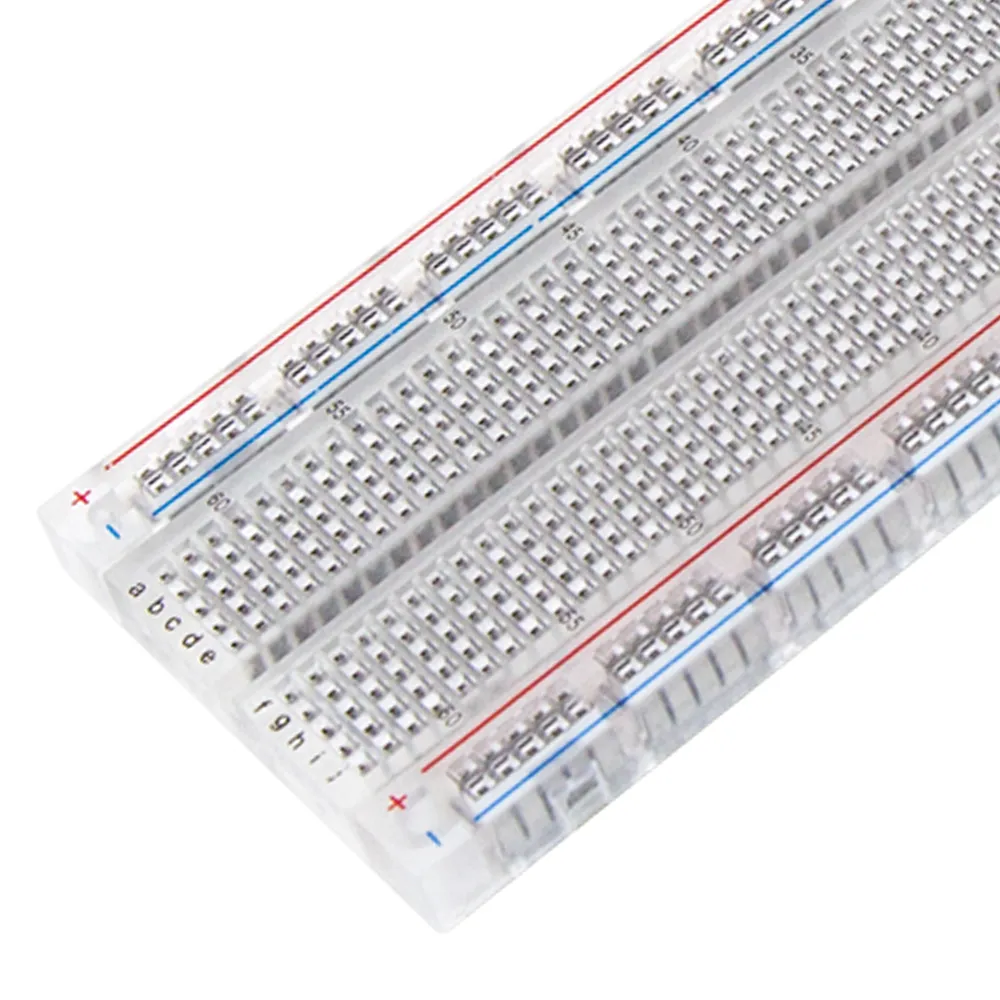
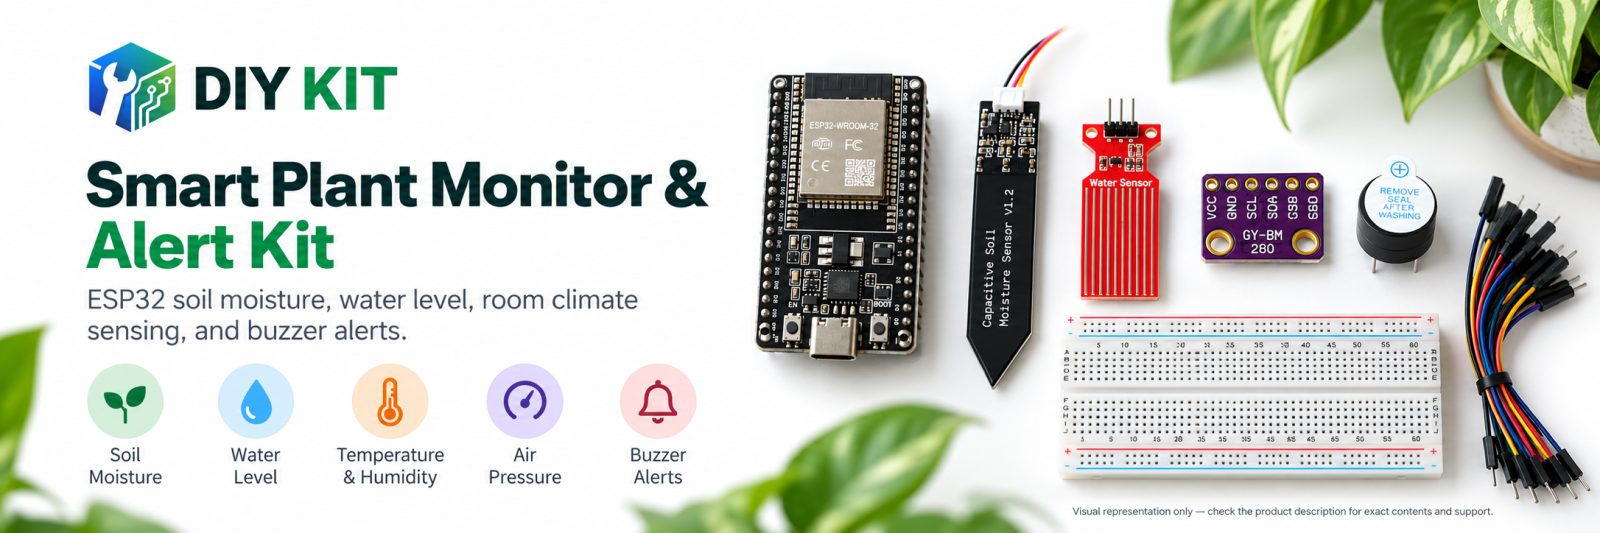
ESP32 Plant Monitoring Learning Kit
All 6 parts in one box, with this project and 6 more to build from them.
Need only these parts? Order them loose · from AED 69.62
One of each part. Packs (resistor assortment, jumper wires) already hold more than a single build needs. Completed main build, computer, spreadsheet software: included in the kit, ask us for it loose. Delivery is AED 20, free on orders AED 100+.
Connections
Unplug USB before you change any wire. Pin names are the labels printed on the board.
| Part / pin | Connect to | Note |
|---|---|---|
| ESP32 3V3 | Breadboard + rail | 3.3 V only — ESP32 inputs must not see 5 V |
| ESP32 GND | Breadboard − rail | |
| BME280 VIN / VCC | + rail (3V3) | |
| BME280 GND | − rail | |
| BME280 SDA | GPIO21 | |
| BME280 SCL | GPIO22 | |
| Soil sensor VCC | + rail (3V3) | |
| Soil sensor GND | − rail | |
| Soil sensor AOUT | GPIO34 | GPIO34 is input-only — ideal for an analog sensor |
| Water sensor + / VCC | + rail (3V3) | |
| Water sensor − / GND | − rail | |
| Water sensor S | GPIO35 | Keep this end of the board dry |
Step by step
- Build the main project wiring (or keep it from the main build): BME280 on GPIO21/22, soil on GPIO34, water on GPIO35.
- For a quick test leave LOG_EVERY_S at 5. For a real afternoon, change it to 300 (one row every 5 minutes).
- Upload the Serial data logger and charts sketch. Open Tools → Serial Monitor at 115200 baud, with the line ending set to Newline. Write down the clock time when it starts.
- Push the soil probe into a pot of dry-ish soil and leave the computer running. Keep the water sensor out of water unless you are doing a short test.
- After a few rows, water the plant and keep logging for an hour or more.
- Untick 'Show timestamp' in the Serial Monitor, then copy all the text and paste it into a spreadsheet. Use Data → Split text to columns (comma) if it lands in one column.
- Make a line chart of soil_raw against t_s, and another of temperature and humidity.
Sketch for this project
Written for the board in the kit. Copy it into the Arduino IDE; change the pin numbers if you wire it differently.
/*
  ESP32 Plant Monitoring Learning Kit
  Project 5: Serial data logger and charts

  Wiring: the whole kit - soil GPIO34, water GPIO35, BME280 on I2C 21/22.

  What you learn: a sensor reading on its own says little; a log over an
  afternoon tells the story. This sketch prints one CSV row every
  LOG_EVERY_S seconds. Copy the Serial monitor into a spreadsheet, make a
  chart, and you have the watering history. Raw values are logged on
  purpose: calibrate later, in the spreadsheet, without re-running.
*/

#include <Wire.h>
#include <Adafruit_Sensor.h>
#include <Adafruit_BME280.h>

Adafruit_BME280 bme;

const int SOIL_PIN = 34;
const int WATER_PIN = 35;
const int LOG_EVERY_S = 5;        // 5 s here; 300 s for a real afternoon
const int ADC_SAMPLES = 16;

unsigned long rowNumber = 0;
unsigned long lastRow = 0;
bool bmeOk = false;

int readAverage(int pin) {
  long sum = 0;
  for (int i = 0; i < ADC_SAMPLES; i++) { sum += analogRead(pin); delay(2); }
  return sum / ADC_SAMPLES;
}

void setup() {
  Serial.begin(115200);
  pinMode(SOIL_PIN, INPUT);
  pinMode(WATER_PIN, INPUT);
  analogReadResolution(12);
  Wire.begin(21, 22);
  bmeOk = bme.begin(0x76, &Wire);
  Serial.println("row,t_s,soil_raw,water_raw,temp_c,humidity_pct,pressure_hpa");
}

void loop() {
  if (rowNumber > 0 && millis() - lastRow < (unsigned long)LOG_EVERY_S * 1000UL) return;
  lastRow = millis();
  rowNumber++;
  Serial.print(rowNumber); Serial.print(",");
  Serial.print(millis() / 1000); Serial.print(",");
  Serial.print(readAverage(SOIL_PIN)); Serial.print(",");
  Serial.print(readAverage(WATER_PIN)); Serial.print(",");
  if (bmeOk) {
    Serial.print(bme.readTemperature(), 1); Serial.print(",");
    Serial.print(bme.readHumidity(), 1); Serial.print(",");
    Serial.println(bme.readPressure() / 100.0, 1);
  } else {
    Serial.println("NA,NA,NA");
  }
}- LOG_EVERY_S (5) sets the time between rows. 300 = every 5 minutes.
- ADC_SAMPLES (16) readings are averaged for each analog value.
- The BME280 columns show NA,NA,NA if the sensor is not found, so you can log soil only.
What you should see
- A header row,t_s,soil_raw,water_raw,temp_c,humidity_pct,pressure_hpa, then one row per interval.
- After watering, soil_raw changes sharply then slowly drifts back as the pot drains and dries.
- Temperature and humidity following the room through the day.
If it doesn't work
| Problem | What to check |
|---|---|
| Upload fails or no port appears | Use a USB cable that carries data, not a charge-only one. Hold the BOOT button while the upload starts if it stays at 'Connecting…'. |
| Garbled text in the Serial Monitor | Set the baud rate to 115200. |
| Rows stop when the laptop sleeps | Turn off sleep while logging — the data only exists in the Serial Monitor window. |
| Spreadsheet puts everything in one column | Use the split-text-to-columns tool with a comma separator. |
Try next
- Add a percent column in the spreadsheet using your calibration endpoints.
- Log two pots with different soils one after the other and compare drying speed.
More from this kit
BME280 room environment station
Measure temperature, relative humidity, and pressure near a plant while keeping the module dry and away from direct sun, water, fingers, and warm electronics. Compare se…
Optional audible-alert investigation
Characterize the buzzer's current, trigger threshold, and active level before choosing a transistor or driver. Write and compile a separate alert sketch only after the i…
Calibrated plant-monitoring lab
Build the reviewed main project, capture four local calibration endpoints, and stream soil, water, temperature, humidity, pressure, and status data to Serial Monitor. Th…
