Short-Duration Water-Level Experiment
Lower the water sensor step by step into a container and watch the reading climb. The sketch learns the empty and full readings as you go, reports a level, and prints LOW WATER and water OK events — then you study how repeatable it really is.
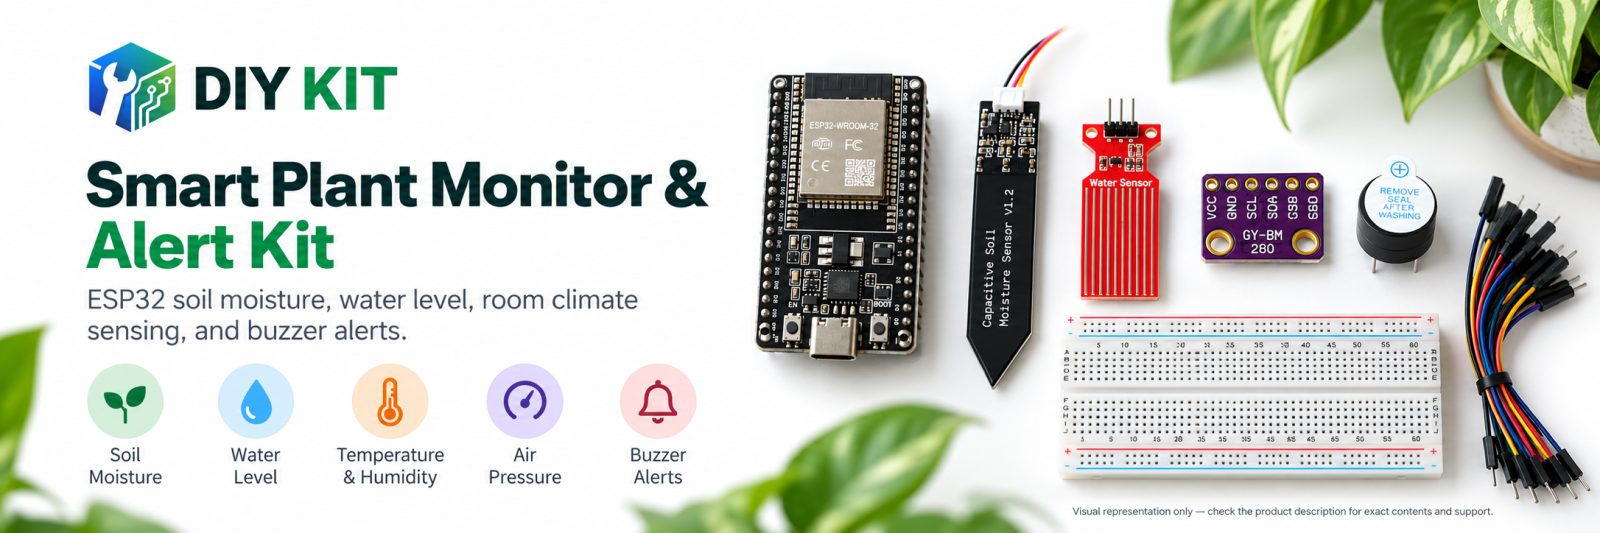
What you build and learn
- How a conductive water sensor turns depth into a voltage
- Why the response is not a straight line
- Detecting a threshold crossing as an event
- Why exposed-copper sensors corrode, and how to care for them
The board has interleaved copper tracks. Water bridges them, and the deeper it goes the more track is bridged, so the voltage on S — and the ESP32's raw reading — rises with depth.
The sketch remembers the lowest raw value it has seen as 'empty' and the highest as 'full', and reports the level as a percentage between them. Below 20 % it prints EVENT: LOW WATER once; rising back above, EVENT: water OK.
The response is not linear, and the tracks slowly corrode in water, so readings drift over time. That is why this sensor suits short supervised tests, not a permanent tank gauge.
What this project uses
Every item is in the kit — nothing extra to buy.

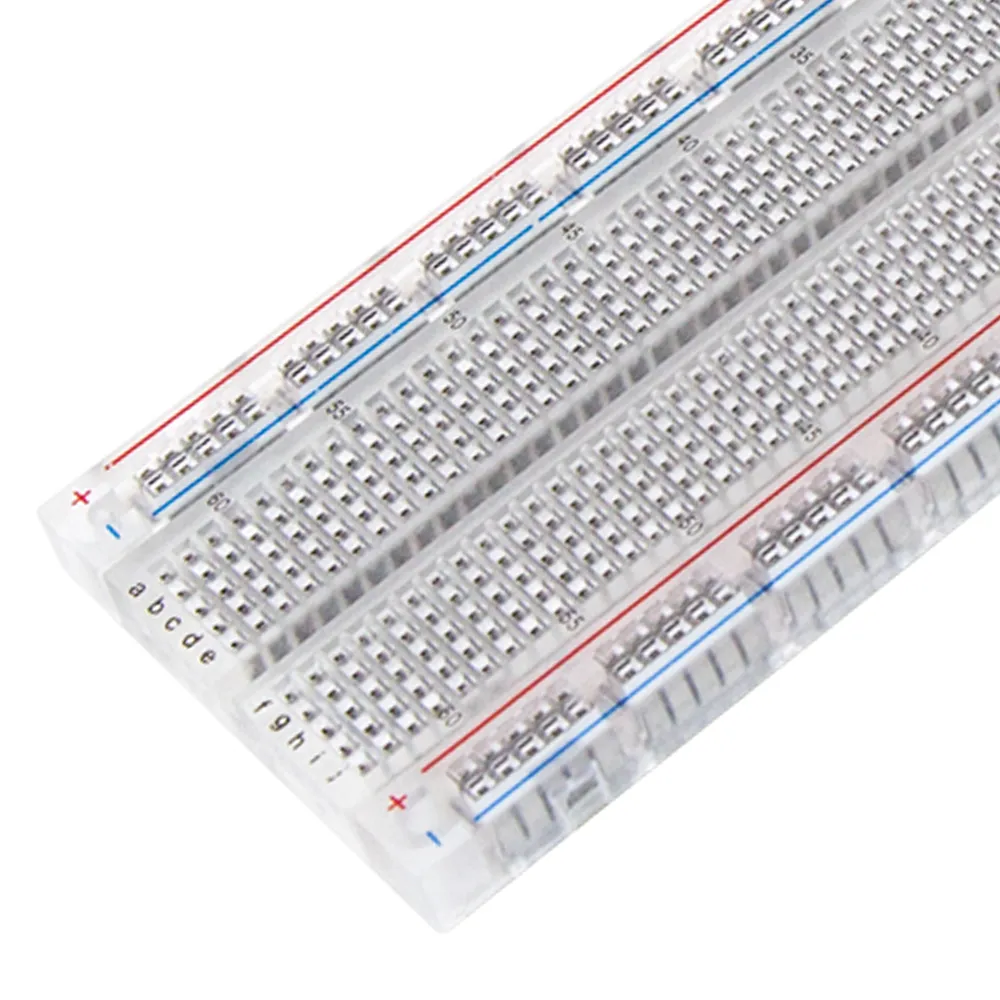
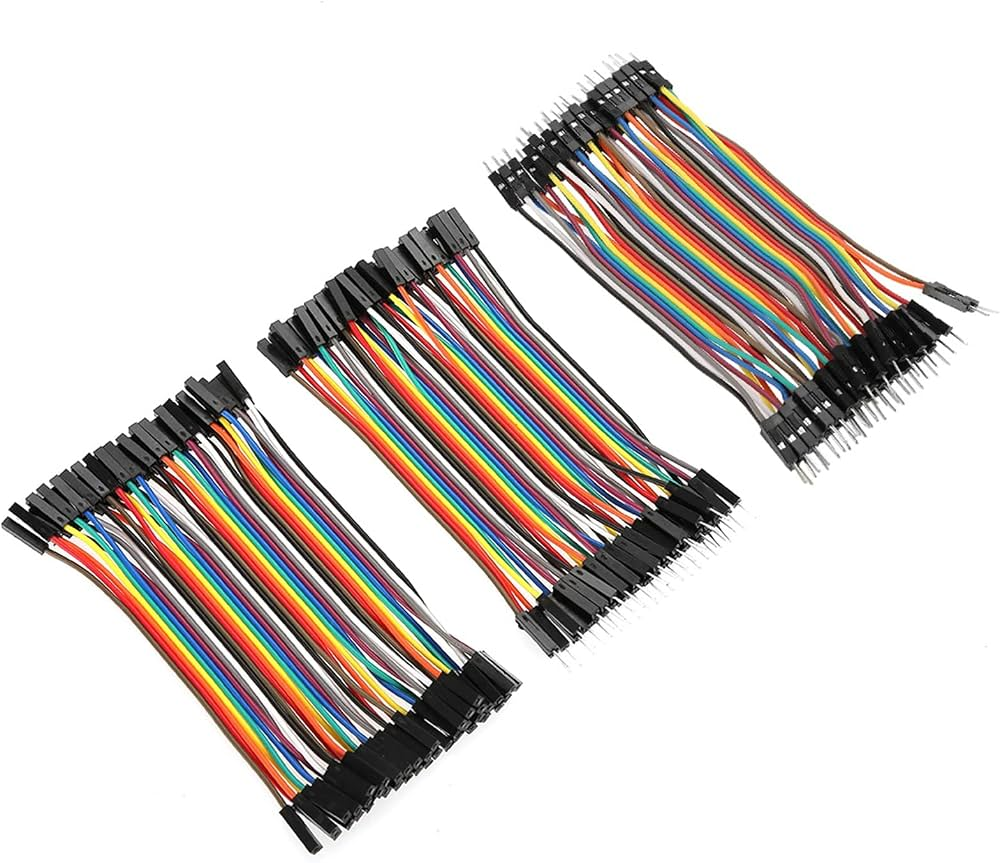
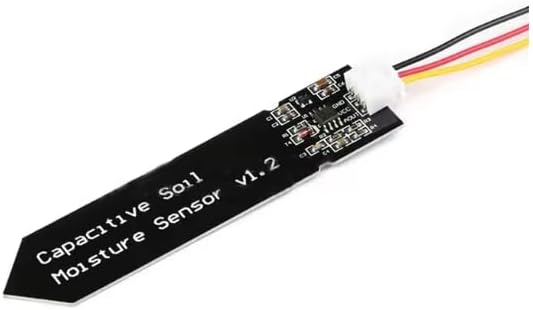
ESP32 Plant Monitoring Learning Kit
All 6 parts in one box, with this project and 6 more to build from them.
Need only these parts? Order them loose · from AED 77.26
One of each part. Packs (resistor assortment, jumper wires) already hold more than a single build needs. ESP32U: included in the kit, ask us for it loose. Delivery is AED 20, free on orders AED 100+.
Connections
Unplug USB before you change any wire. Pin names are the labels printed on the board.
| Part / pin | Connect to | Note |
|---|---|---|
| ESP32 3V3 | Breadboard + rail | 3.3 V only — ESP32 inputs must not see 5 V |
| ESP32 GND | Breadboard − rail | |
| Water sensor + / VCC | + rail (3V3) | |
| Water sensor − / GND | − rail | |
| Water sensor S | GPIO35 | Keep this end of the board dry |
Step by step
- In Arduino IDE install the ESP32 boards package (Boards Manager → esp32 by Espressif) and, from Library Manager, Adafruit BME280 and Adafruit Unified Sensor. Select the ESP32 Dev Module board and your USB port.
- With USB unplugged, wire the water sensor: + to 3V3, − to GND, S to GPIO35. Use longer jumpers so the electronics stay well away from the water.
- Mark depths on the sensor with a pen: 0.5, 1, 2, 3 cm from the bottom of the tracks.
- Upload the Short-duration water-level experiment sketch. Open Tools → Serial Monitor at 115200 baud, with the line ending set to Newline. Start with the sensor dry.
- Lower it to each mark and hold it still for a few seconds. Write down raw and level_pct at each depth.
- Lift it back out step by step and note whether the readings match on the way up. Watch for the LOW WATER and water OK events.
- Unplug USB, rinse the tracks in clean water and dry them with a paper towel.
- Plot raw against depth. Is it a straight line? Repeat tomorrow and compare.
Sketch for this project
Written for the board in the kit. Copy it into the Arduino IDE; change the pin numbers if you wire it differently.
/*
  ESP32 Plant Monitoring Learning Kit
  Project 3: Short-duration water-level experiment

  Wiring: water level sensor + to 3V3, - to GND, S to GPIO35.
  Keep the experiment short and rinse and dry the board afterwards -
  the exposed tracks corrode.

  What you learn: the sensor's tracks conduct more the deeper the water,
  so the raw value rises with the level - but not in a straight line, and
  it drifts as the tracks corrode. The sketch tracks the empty and full
  readings it has seen and reports a level between them.
*/

const int WATER_PIN = 35;
const int ADC_SAMPLES = 16;
const int LOW_WATER_PERCENT = 20;
const unsigned long REPORT_MS = 500;

int emptyRaw = 4095, fullRaw = 0;
unsigned long lastReport = 0;
bool wasLow = true;

int readAverage() {
  long sum = 0;
  for (int i = 0; i < ADC_SAMPLES; i++) { sum += analogRead(WATER_PIN); delay(2); }
  return sum / ADC_SAMPLES;
}

void setup() {
  Serial.begin(115200);
  pinMode(WATER_PIN, INPUT);
  analogReadResolution(12);
  Serial.println("Start with the sensor dry, then lower it into water step by step.");
  Serial.println("t_s,raw,empty_raw,full_raw,level_pct,state");
}

void loop() {
  if (millis() - lastReport < REPORT_MS) return;
  lastReport = millis();
  int raw = readAverage();
  if (raw < emptyRaw) emptyRaw = raw;
  if (raw > fullRaw) fullRaw = raw;
  int level = (fullRaw - emptyRaw) > 100 ? constrain(map(raw, emptyRaw, fullRaw, 0, 100), 0, 100) : 0;
  bool low = level < LOW_WATER_PERCENT;
  if (low != wasLow) { wasLow = low; Serial.println(low ? "EVENT: LOW WATER" : "EVENT: water OK"); }
  Serial.print(millis() / 1000); Serial.print(",");
  Serial.print(raw); Serial.print(",");
  Serial.print(emptyRaw); Serial.print(",");
  Serial.print(fullRaw); Serial.print(",");
  Serial.print(level); Serial.print(",");
  Serial.println(low ? "LOW" : "OK");
}- LOW_WATER_PERCENT (20) sets the LOW WATER event threshold.
- Empty and full are learned from the lowest and highest readings since start-up. Press EN to reset them.
- REPORT_MS (500) prints twice a second; ADC_SAMPLES (16) readings are averaged each time.
What you should see
- A header t_s,raw,empty_raw,full_raw,level_pct,state.
- raw near the bottom of the range when dry, rising as you lower it into water.
- EVENT: LOW WATER when the level falls below 20 %, EVENT: water OK when it rises again.
- The water sensor's tracks are bare copper. Dip it only for short tests, keep the connector end dry, then rinse and dry it — left in water it corrodes within days.
If it doesn't work
| Problem | What to check |
|---|---|
| Upload fails or no port appears | Use a USB cable that carries data, not a charge-only one. Hold the BOOT button while the upload starts if it stays at 'Connecting…'. |
| Garbled text in the Serial Monitor | Set the baud rate to 115200. |
| Raw stays near 0 in water | Check S is on GPIO35 and + on 3V3. Make sure the tracks, not the connector end, are in the water. |
| Readings creep up while held still | Normal for this kind of sensor — water wicks up and the tracks polarise. Note it as part of the experiment. |
Try next
- Try tap water against water with a pinch of salt and compare readings at the same depth.
- Use your marked depth as the water-full capture in the main build.
More from this kit
Calibrated plant-monitoring lab
Build the reviewed main project, capture four local calibration endpoints, and stream soil, water, temperature, humidity, pressure, and status data to Serial Monitor. Th…
Soil-moisture calibration study
Compare raw ADC readings across documented dry, damp, and wet samples of one soil type. Repeat probe depth and compaction, graph the results, and explain why the percent…
BME280 room environment station
Measure temperature, relative humidity, and pressure near a plant while keeping the module dry and away from direct sun, water, fingers, and warm electronics. Compare se…
